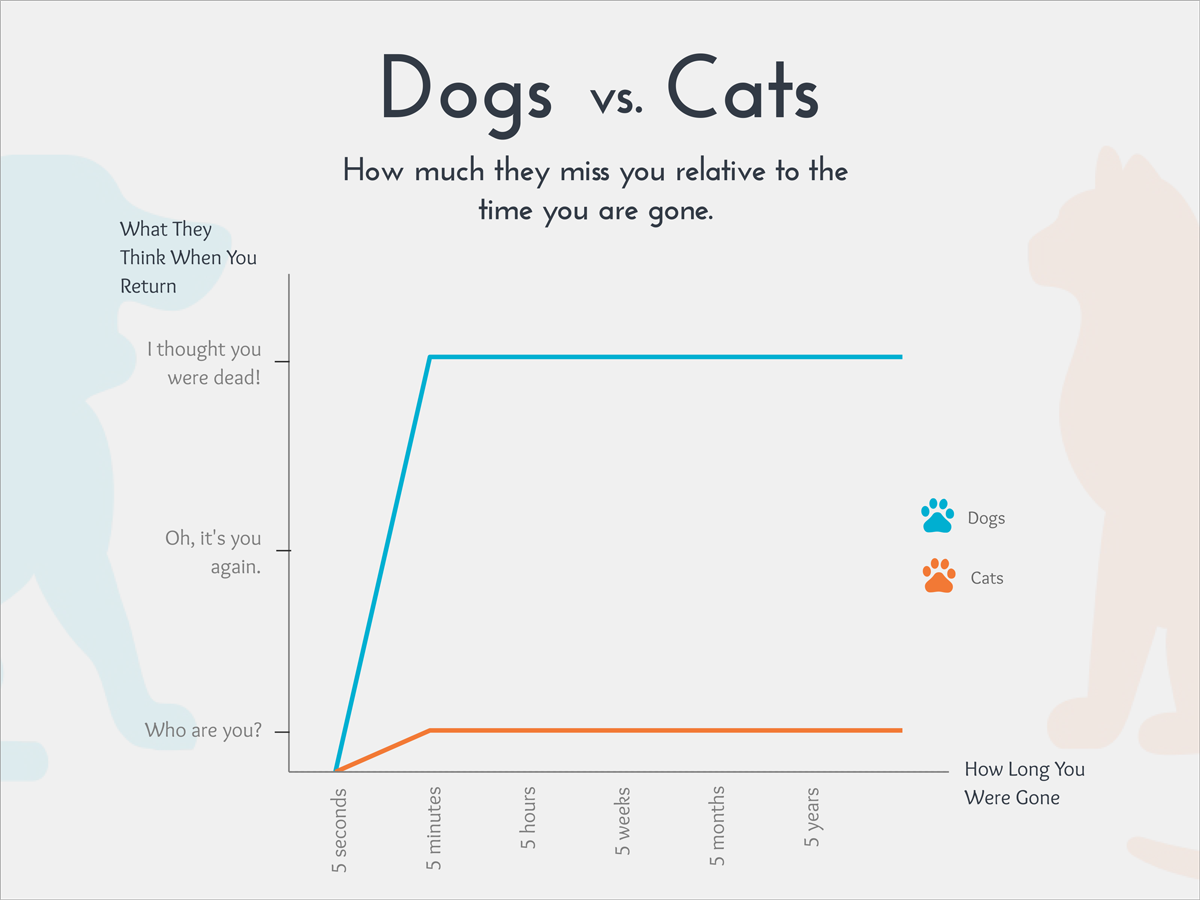
There's nothing quite like graphs to understand things quickly AND delve deep into data at the same time. Seeing information visually can also help with decision making, like the graph below contributing to the age old question of whether dogs are better than cats*.
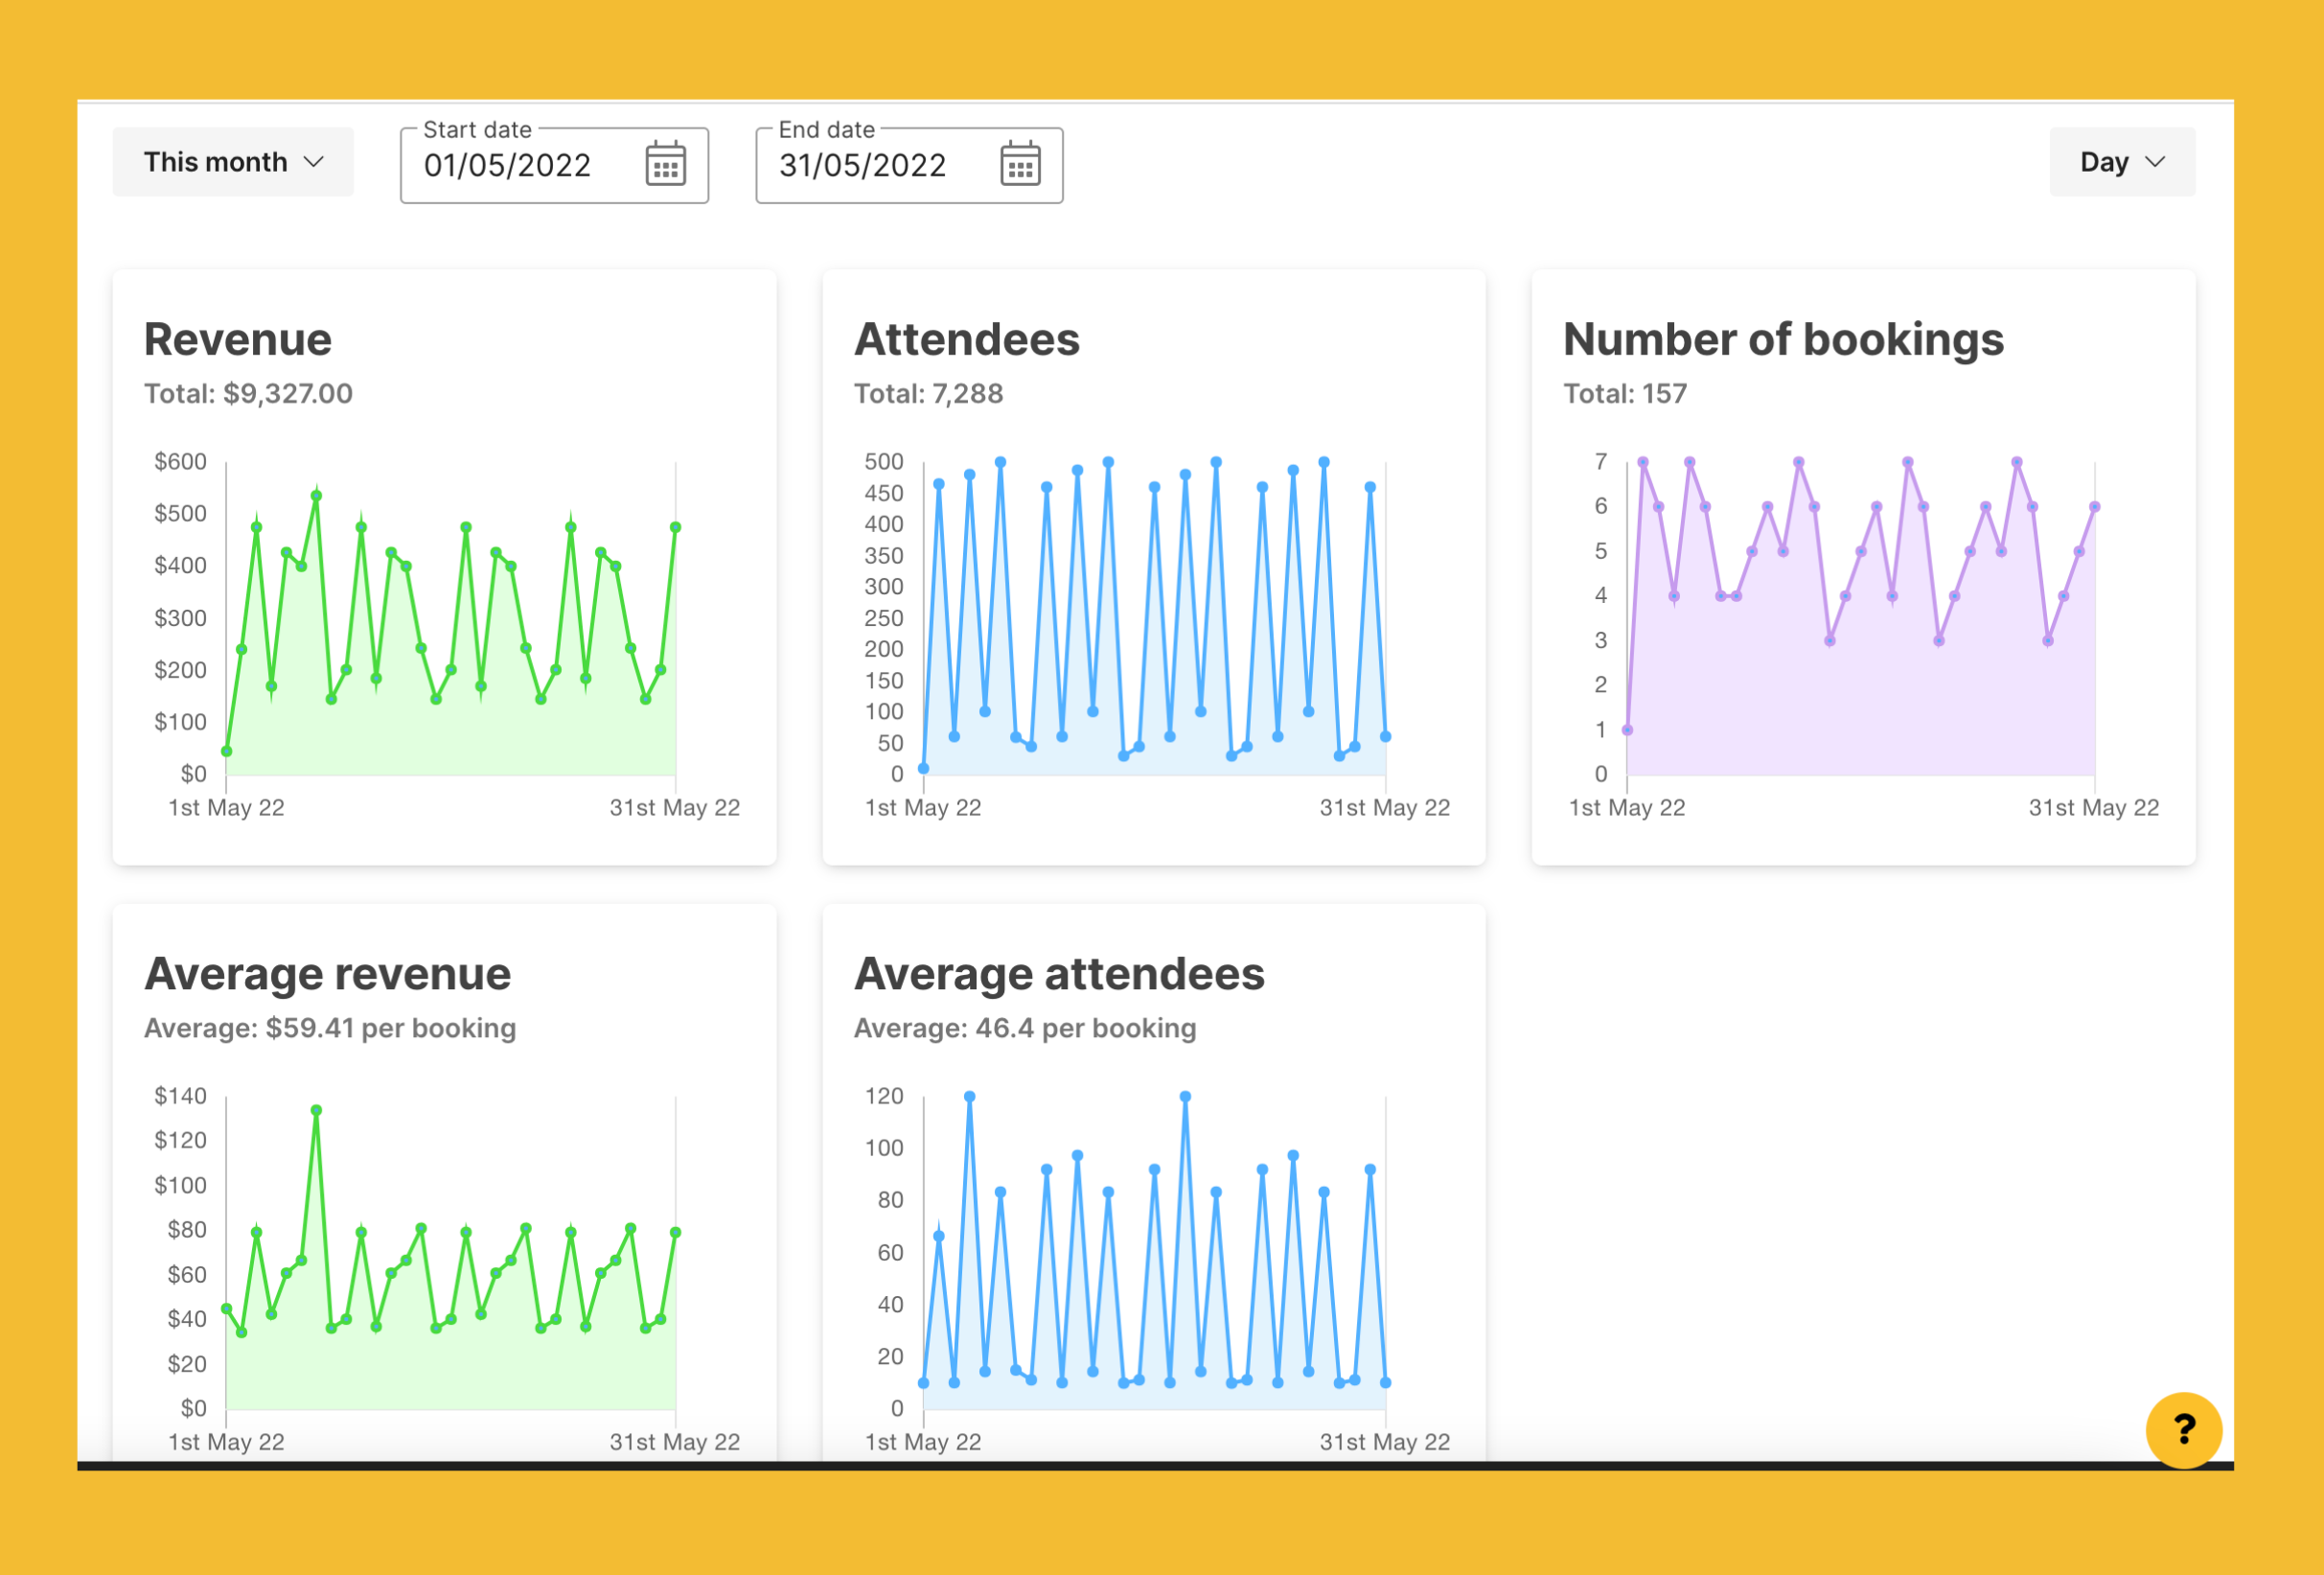
Lucky for our hosts, SpacetoCo has just unveiled its newest feature called Graph Mode! It allows you to see bookings plotted out on various graphs including revenue, number of attendees and bookings, average revenue, and average attendees - with more graphs to come.
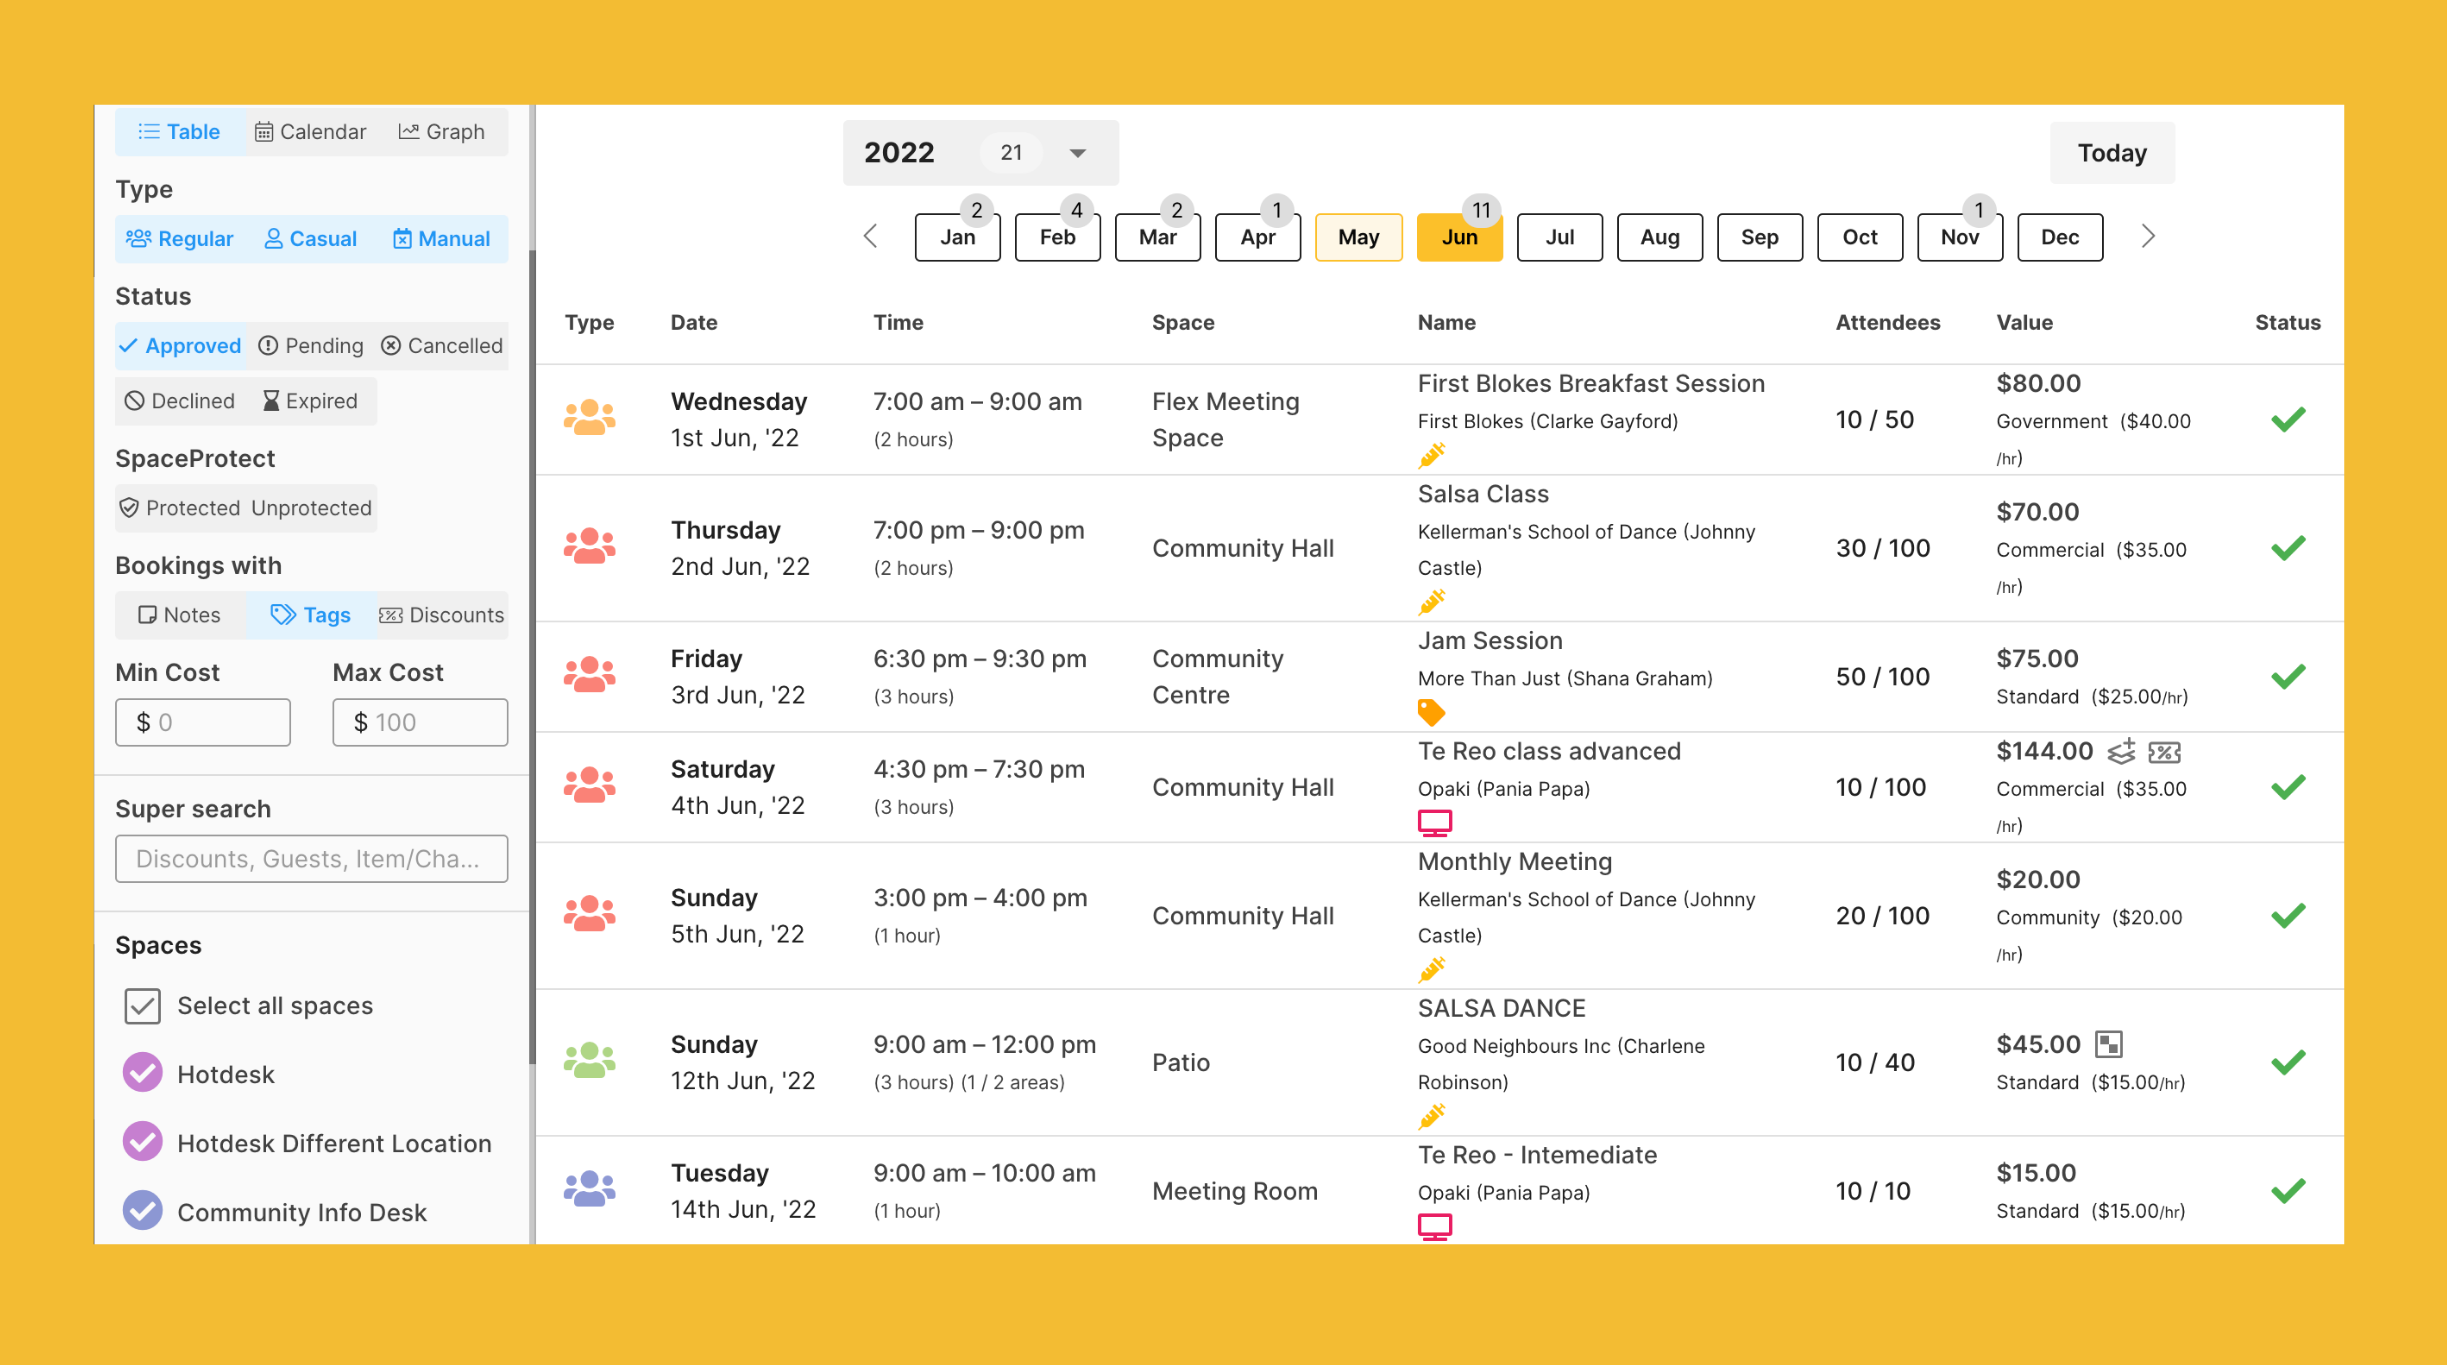
Wait, there's more! Hosts can now filter out bookings that have notes, tags and/or discounts:
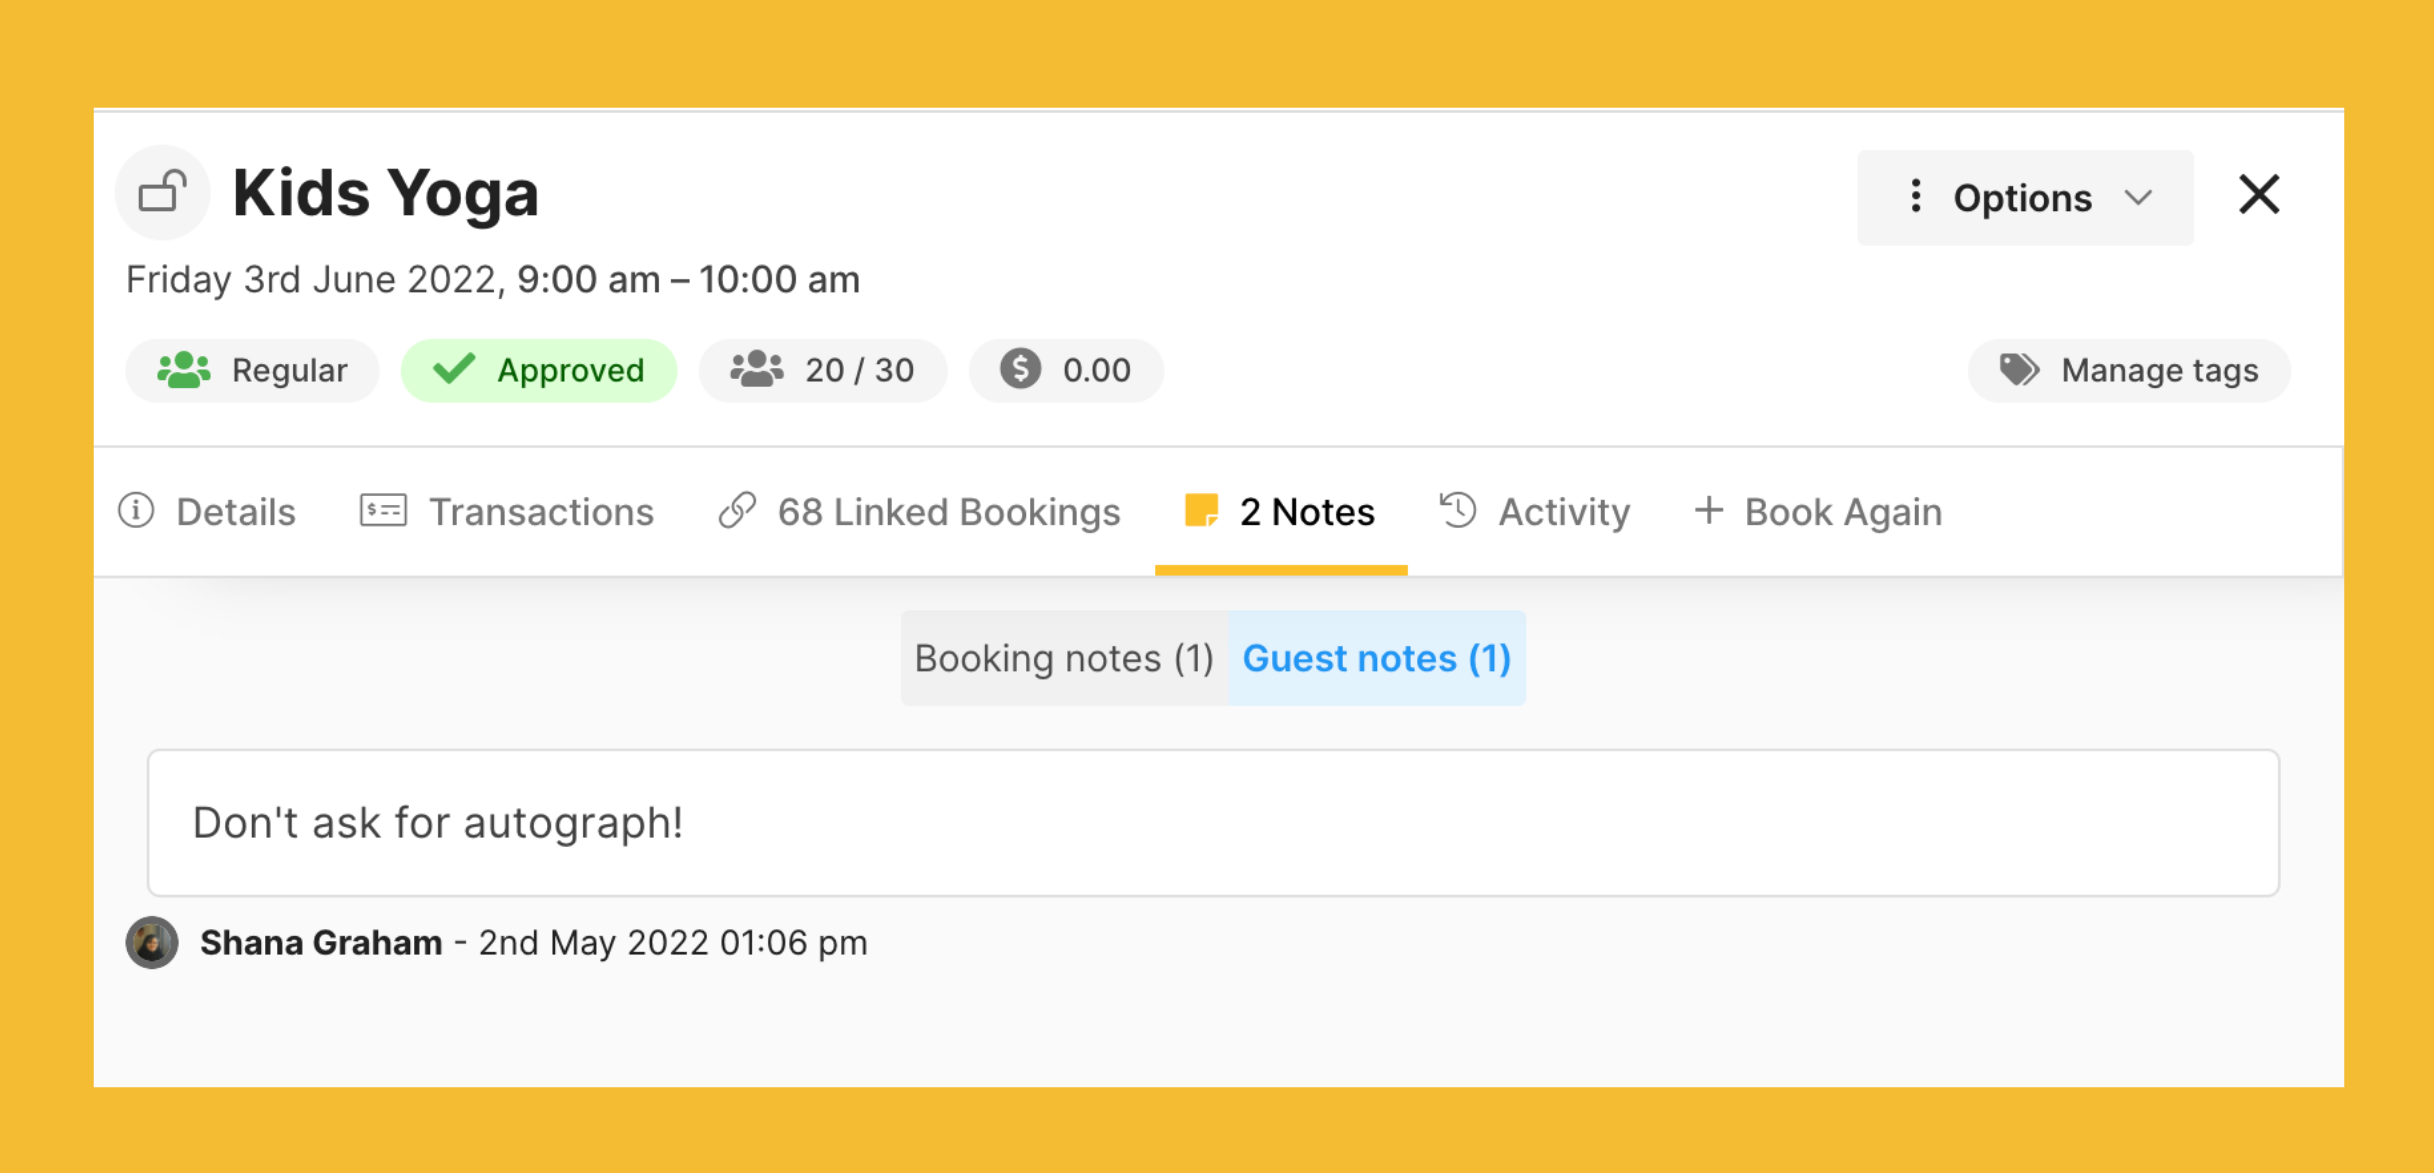
...find notes about a booking's guest under Guest notes:
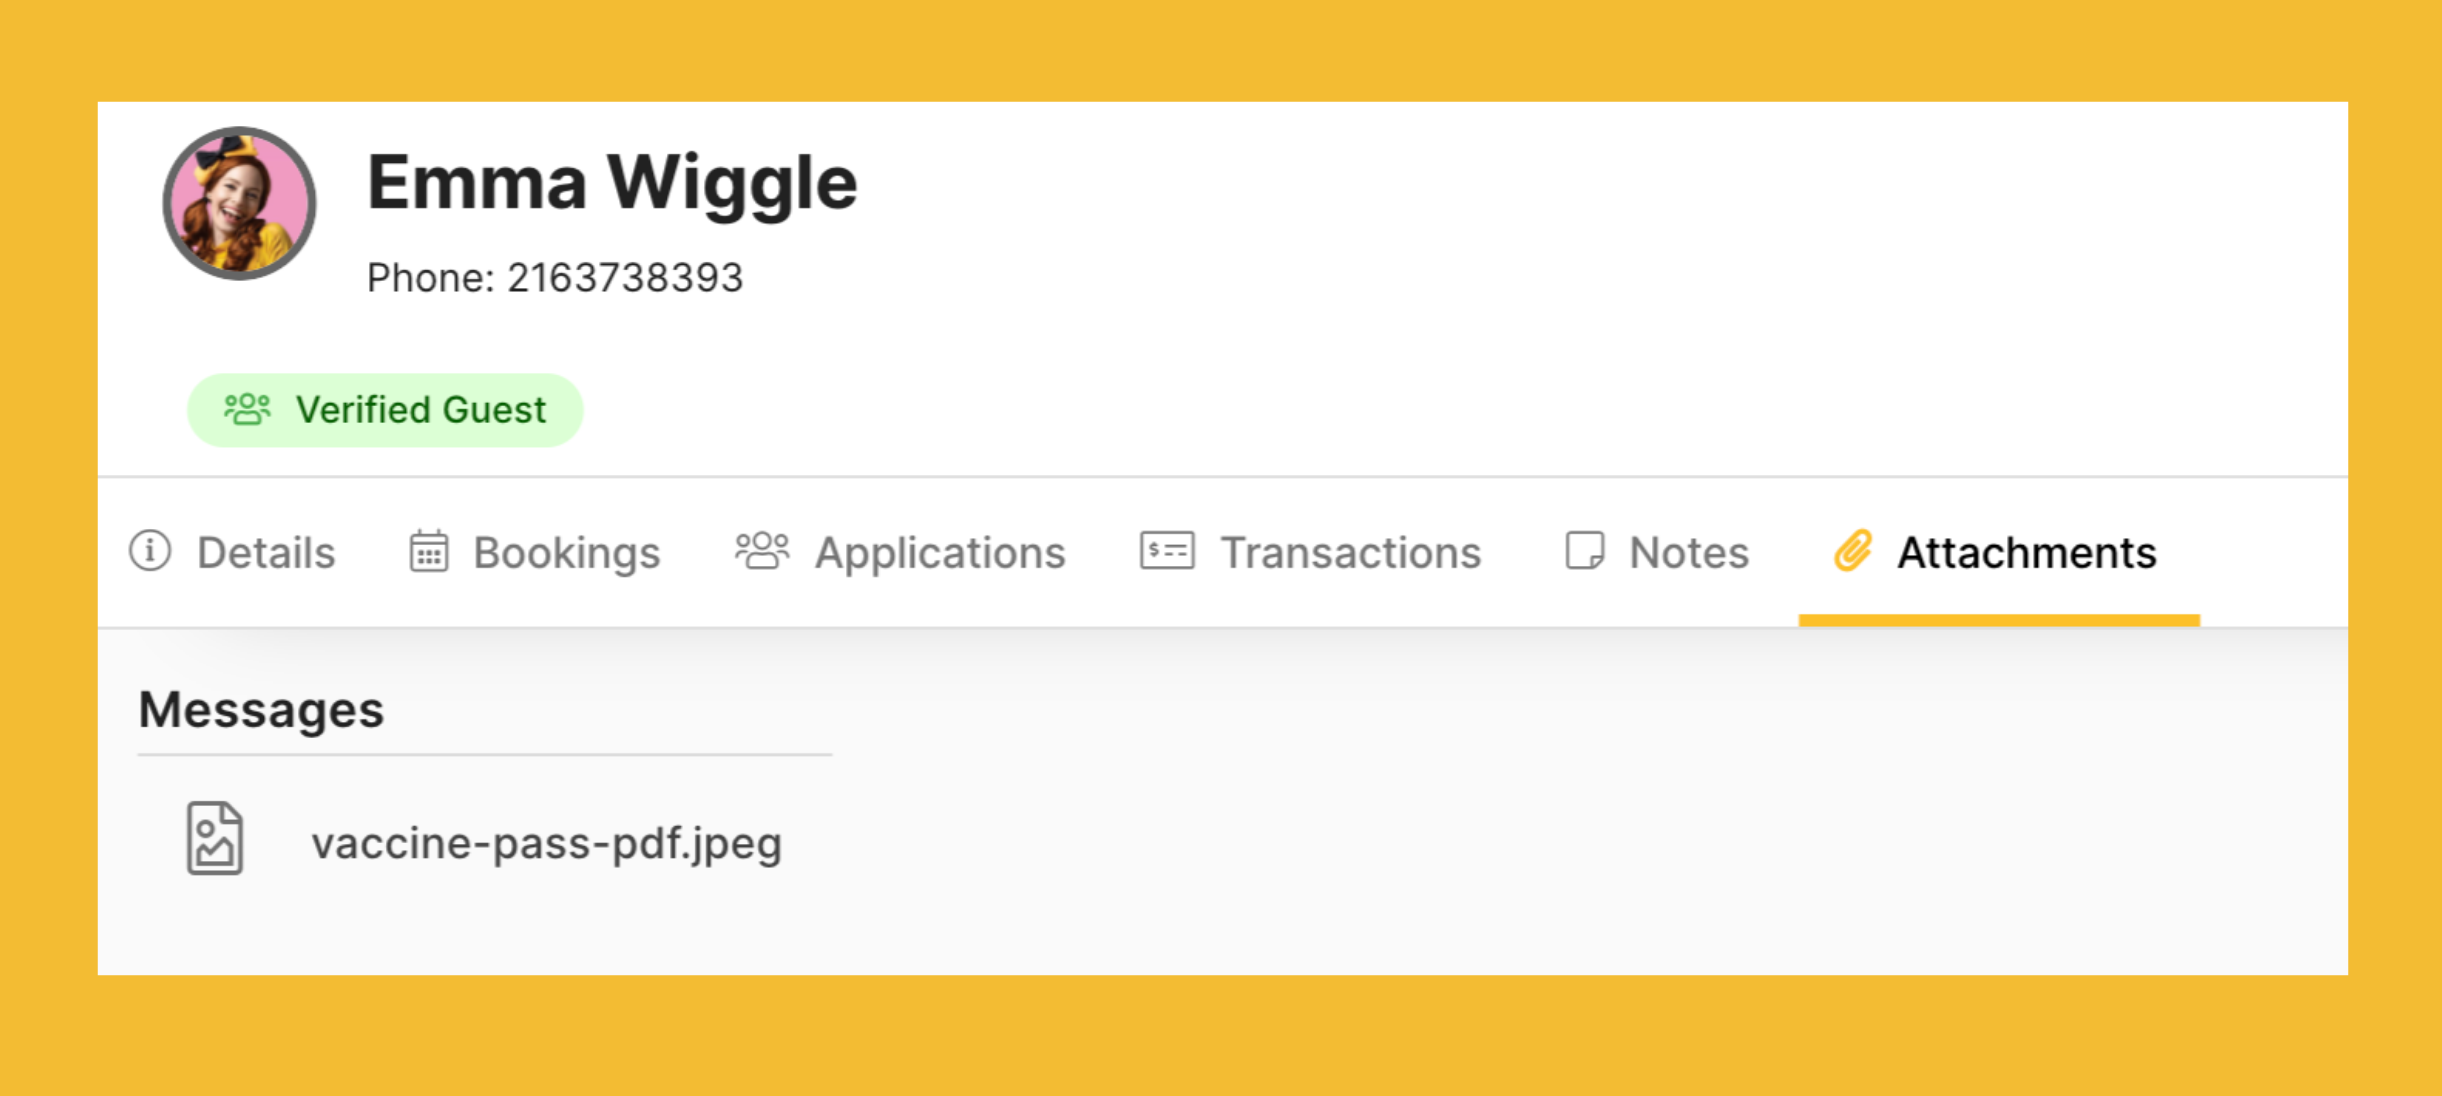
...and see all of a guest's documents under the Attachments tab in their profile:
To find out more about these awesome updates, check out the video below.
*Dogs are definitely better than cats**
**This does not represent the opinion of SpacetoCo (but it should be 😝)